
English
Errors and the debugger
Types of errors
Program errors fall into three categories (Fig. 6.1):
- syntax errors (compilation errors) — violations of language rules: a missing semicolon, undeclared variable, or type mismatch. The compiler finds them, and the program cannot run until they are fixed. Warnings and code analyzer messages are related: the program builds, but the code probably contains an error (for example CS8602 about a possible
nullvalue); - runtime errors — situations in which the program cannot continue: invalid input, integer division by zero, or an array access out of bounds. In .NET, they appear as exceptions;
- logic errors — the program runs without messages but gives an incorrect result: a wrong formula,
<instead of<=, or integer division. Find them through testing and debugging.
Figure 6.1. Types of errors and how they are detected
Logic errors are the most dangerous: the program does not report them. A debugger is designed to help find them.
The Visual Studio debugger
The debugger lets you pause a program at a chosen location, execute one statement at a time, and inspect variable values (https://learn.microsoft.com/visualstudio/debugger/debugger-feature-tour). Table 6.1 lists the main actions.
Table 6.1. Stepping commands
| Keys | Command | Action |
|---|---|---|
| F9 | Toggle Breakpoint | set or remove a breakpoint on the current line |
| F5 | Start Debugging / Continue | start debugging or continue to the next breakpoint |
| F10 | Step Over | execute the line; method calls run in full |
| F11 | Step Into | execute the line, entering the called method |
| Shift+F11 | Step Out | finish the method and return to its caller |
| Ctrl+F10 | Run To Cursor | run to the line containing the cursor |
| Ctrl+Shift+F10 | Set Next Statement | choose another line to execute next (drag the yellow arrow) |
| Shift+F5 | Stop Debugging | stop debugging |
| Ctrl+Shift+F5 | Restart | restart the program |
A breakpoint marks a line before which execution pauses. Set one by clicking the margin to the left of the line number or pressing F9; the line is marked with a red dot. When execution pauses, a yellow arrow shows the line that will execute next, and stepping buttons appear on the Debug toolbar (Fig. 6.2).
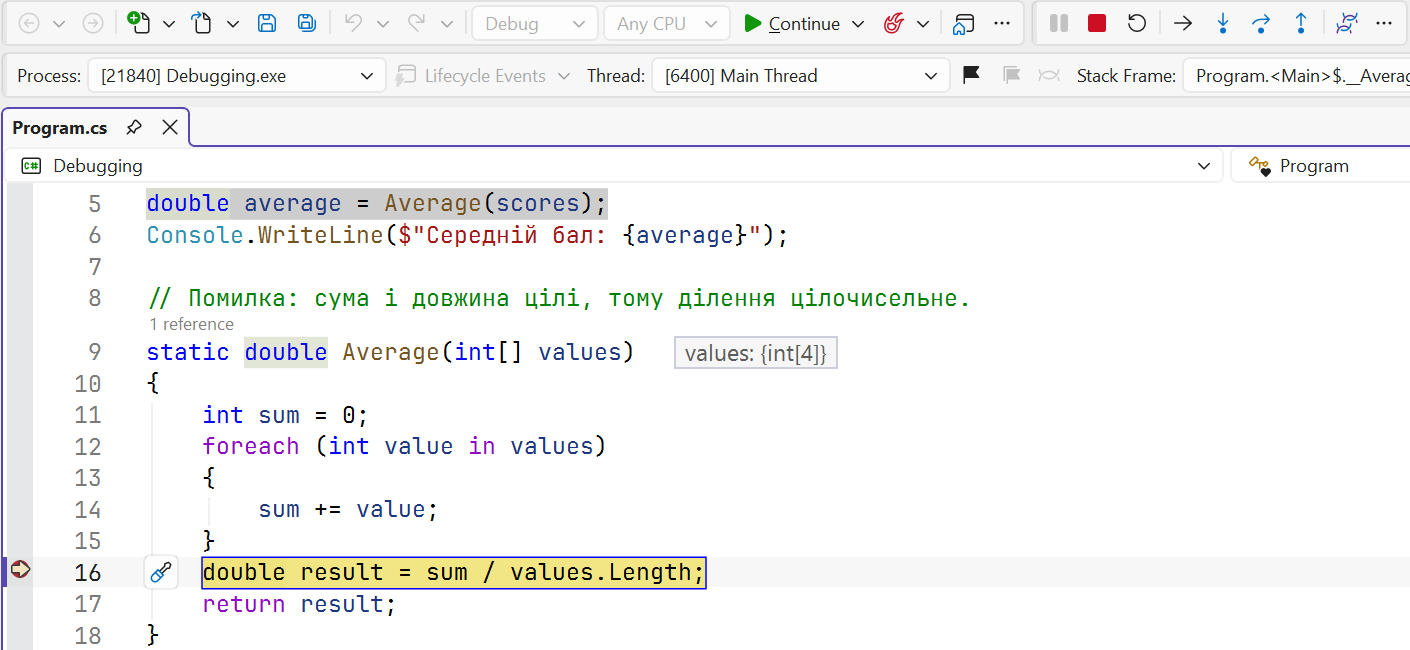
Figure 6.2. The debug toolbar and execution paused at a breakpoint
A typical procedure for finding a logic error:
- Identify which result is incorrect and for which inputs.
- Set a breakpoint before the code that computes this result.
- Run the program (F5) and step through it (F10, F11), comparing variable values with expected values calculated by hand.
- Find the first line after which a value becomes incorrect — that is where the error is.
Debugger windows
While execution is paused, several windows show program state (Debug → Windows):
- Locals — all local variables in the current method;
- Autos — variables used on the current and previous lines;
- Watch — expressions you add (
sum / values.Length,values[i] > max); values update after each step; - Call Stack — the chain of method calls leading to the current line (Topic 5);
- Immediate — a window for evaluating expressions or calling methods while paused (Fig. 6.3).
A DataTip also shows a variable’s value when you hover over it in the editor. In Locals, Watch, and DataTips, you can change values by double-clicking: this lets you test whether another value fixes the error without restarting the program.
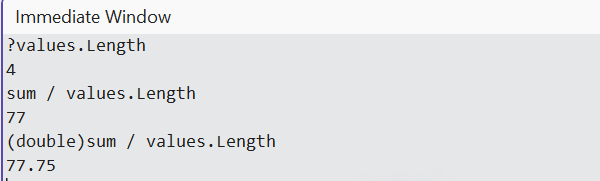
Figure 6.3. Evaluating expressions in the Immediate window
Conditional breakpoints and tracepoints
If an error occurs only on the 57th loop iteration, for example, pausing on every iteration is inconvenient. In breakpoint settings (right-click the red dot → Conditions…), you can specify (https://learn.microsoft.com/visualstudio/debugger/using-breakpoints):
- a condition (Conditional Expression) — a C# expression such as
i == 57orsum > 1000; execution pauses only when it is true; - a hit count (Hit Count) — pause, for example, on every tenth hit;
- an action (Actions) — write a message to the Output window, such as
i = {i}, sum = {sum}. If Continue code execution remains selected, the breakpoint becomes a tracepoint: execution continues while values are logged (Fig. 6.4).
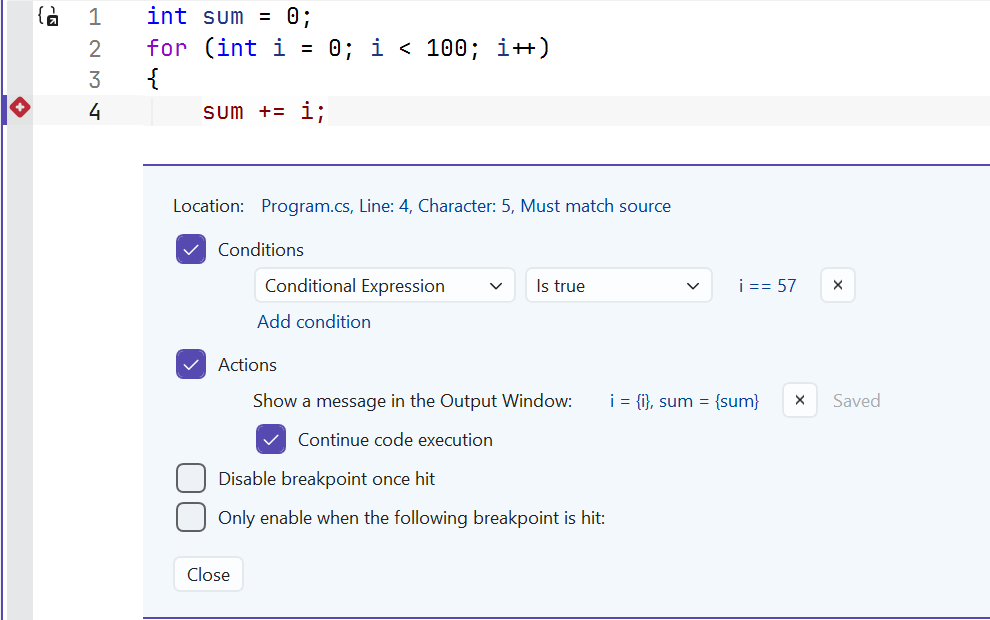
Figure 6.4. Configuring a conditional breakpoint
Hot Reload (the flame button on the toolbar or Alt+F10) applies code changes to a running program without restarting it. It supports most changes inside method bodies, so you can test a corrected formula immediately while debugging.